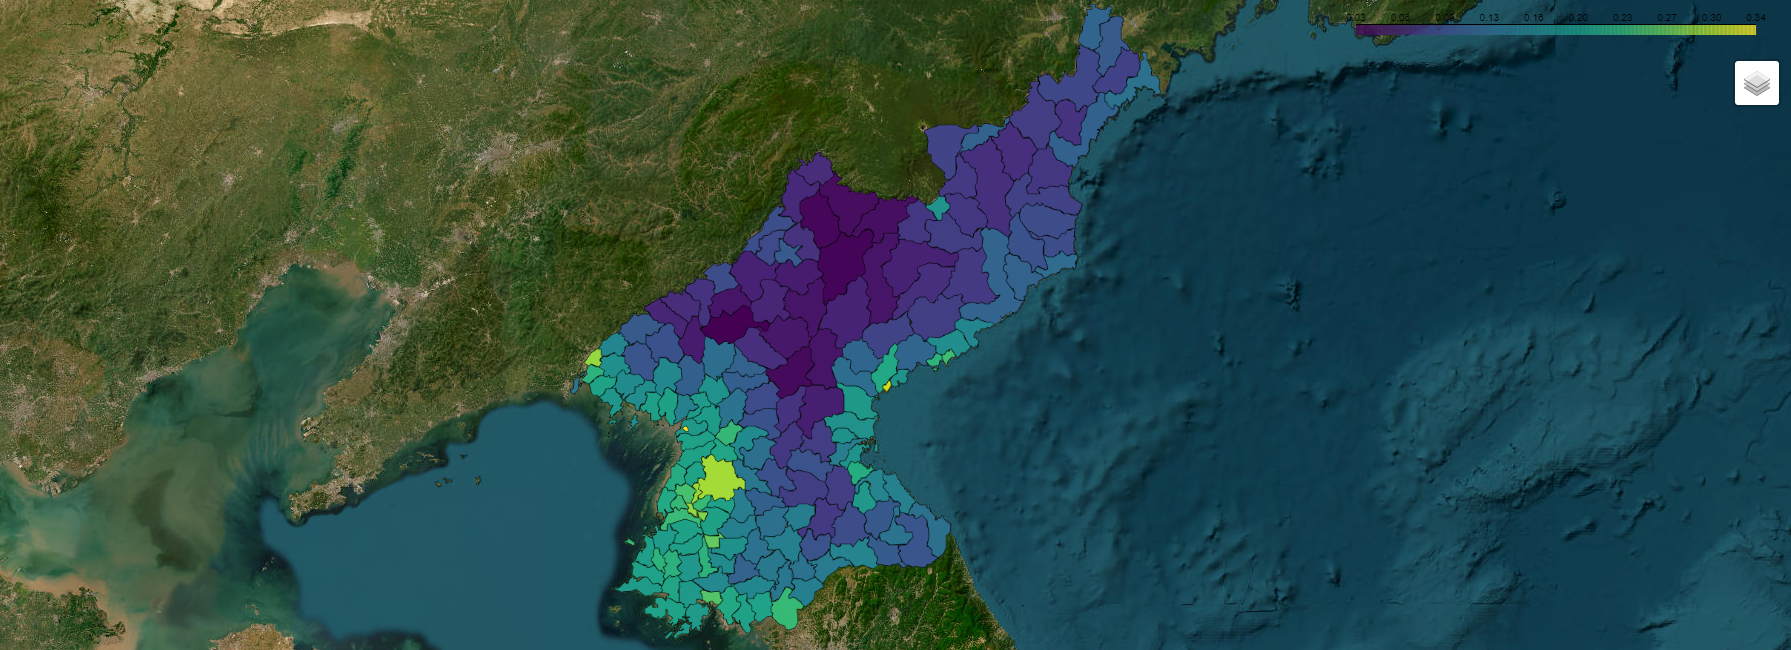
Grid-level siScore map on North Korea
siScore interactive map on NK
Grid-level, 2016, 2019, 4 years avg
Quick overview of prediction results over North Korea (Grid-level),
accepted in Nature Communcations (paper link : TBD)
Codes are all available on GitHub
To comply with the file size upload limit (<100MB), we present grid-level maps for 2016, 2019, and the 4-year average (2016-2019) only.
We are looking for alternative solutions to deliver our result with better accessibility.